
Page speed isn’t up for discussion at this point. Google has said it a million times: it's a top-ranking factor. You need to give your users fast-loading pages for a better experience on your website. And while the topic can get technical, the right tools make it easy to spot and fix page speed issues.
In this article, I'll go over what you can do to increase your page speed with the help of tools like PageSpeed Insights, Chrome DevTool, and of course, SiteGuru.
Let's dive in!
How Is Page Speed Measured?
Google uses the PageSpeed Insights (PSI) tool to measure real-user experience data of a page on both mobile and desktop devices. The tool runs on the Lighthouse technology and is powered by the Chrome User Experience Report (CrUX) dataset.
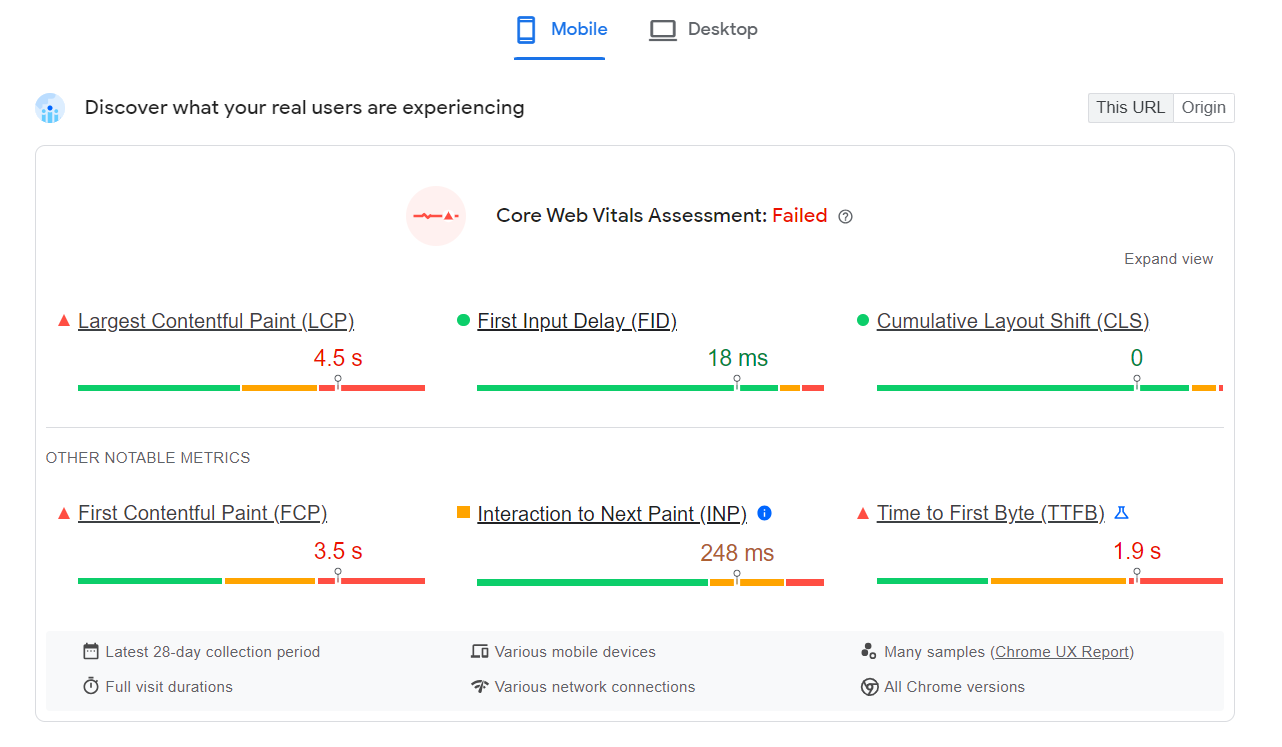
PSI reports real users' Core Web Vitals, which are Google's quality signals for a great user experience on the web. These are:
- First Contentful Paint (FCP) - The time it takes for a page to load the first portions of the content.
- First Input Delay (FID) - How long it takes for the browser to respond to a user action.
- Largest Contentful Paint (LCP) - How quickly all the content on the page loads.
- Cumulative Layout Shift (CLS) - How much the website shifts as it loads.
- Interaction to Next Paint (INP) - Overall responsiveness of a page.
Time to First Byte (TTFB) - How long it takes between the user performing an action and seeing the change happen on the page.
This gives you an overall score (known as Pagespeed Index) between 1 and 100. For your page to be considered "fast," your pages should have a score of 90 or above.
Pages with a score under 50 are considered "slow" and will be in the red, whereas any pages with scores between 50 and 90 could do better.
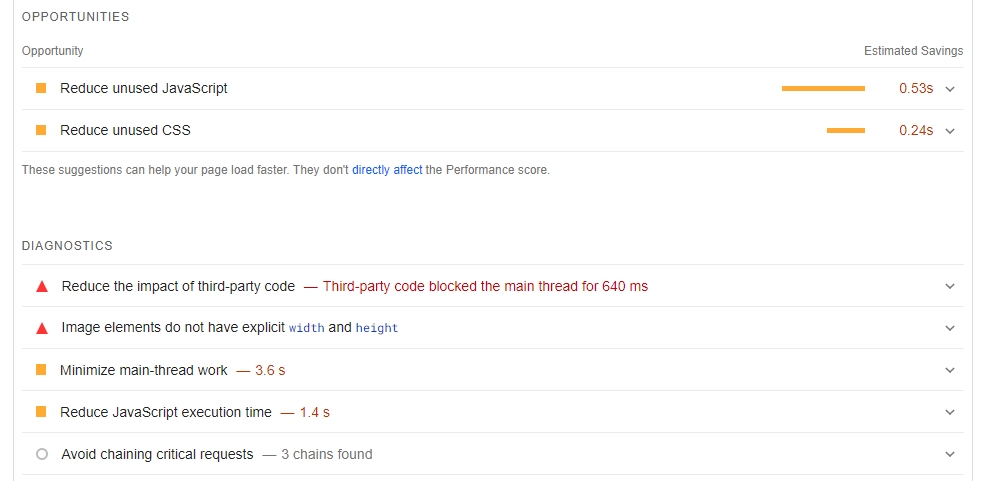
However, the real value of PSI lies in the "Opportunities" section, where users can find actionable improvement suggestions. The problem is - you can only analyze them one page at a time, unless you use a tool like SiteGuru.
How Do I Know I Have Issues with My Page Speed?
If you want to be proactive about it, you’ll need more than PageSpeed Insights, which runs a test on demand. Similarly, you could use Lighthouse in Chrome Dev Tools, especially if you need to audit pages that aren't live yet, or the "Enhancements" section of Google Search Console, which also features the Core Web Vitals metrics.
That said, the above tools will only be useful if you'd like to analyze individual pages.
If you want to audit several pages at once regularly, look for a solution like SiteGuru's PageSpeed report.
Get Notified and Track Page Speed Issues with SiteGuru
There are two ways you can view page speed issues with SiteGuru.
The first way is through the main dashboard in Overview ? Home.
Once you connect your Google accounts to SiteGuru and it starts fetching your data, it runs a weekly SEO audit, giving you a no-brainer SEO to-do list with tasks you can complete to improve your rankings.
Your to-do list shows up on the left-hand side of the screen as soon as you land on your dashboard.
If your site has any problems with page speed, you'll see the following notification according to the number of affected pages and the impact of the issue:

If you click on the "Improve page speed" task, you'll be sent to your Page speed report.
You can also find it at Technical ? Pagespeed.
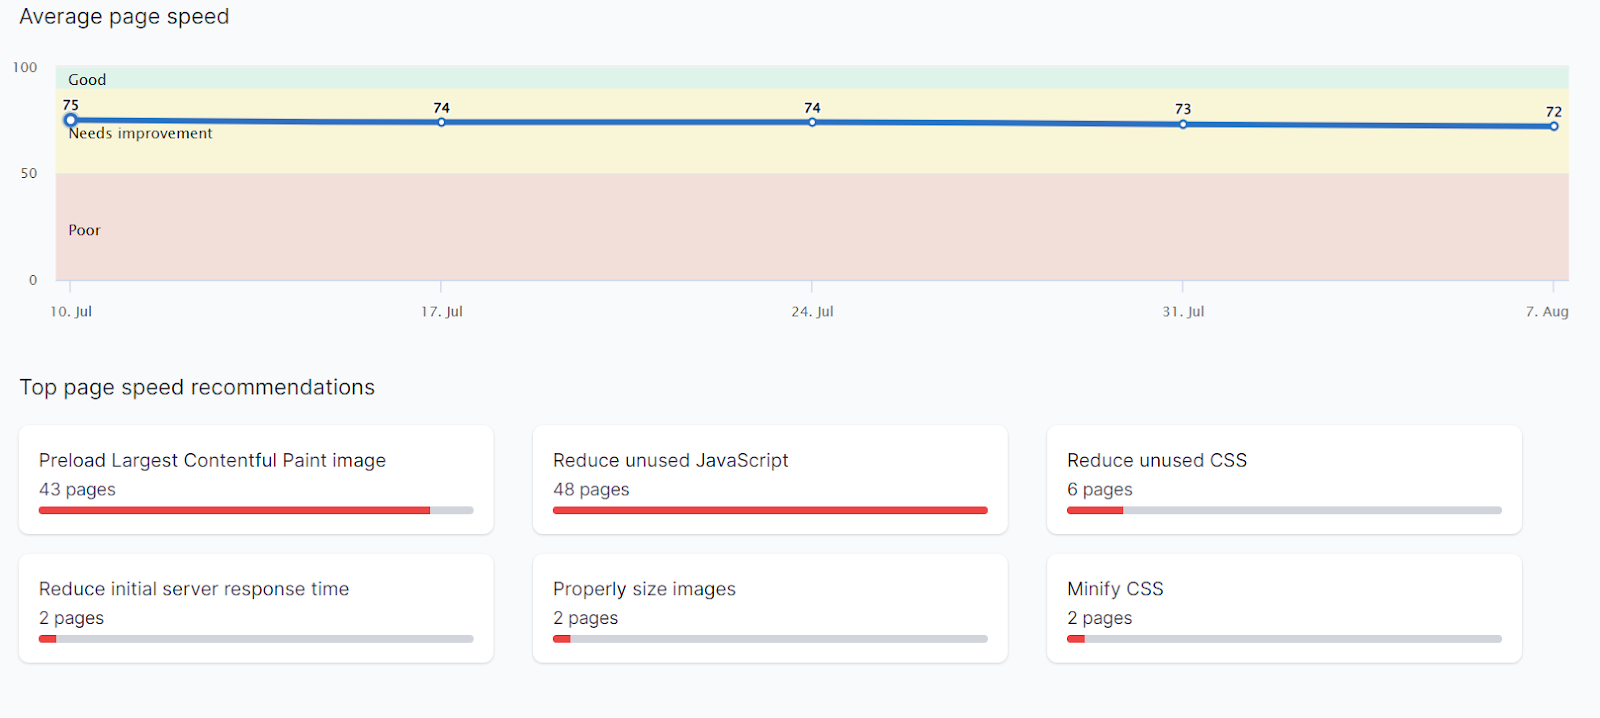
This performance report can scan up to 100 pages using your PSI data. It gives you the average PageSpeed Index for your pages and top recommendations for improving it, as shown in the example below:
Scroll down a little, and you'll see an overview of the performance of each of your pages: the slow ones, the "okay" ones, and the fast ones.
Right below the overview, you'll see the URL of each page, followed by its Pagespeed score, its Largest Contentful Paint (LCP) score, and its Cumulative Layout Shift (CLS) score.
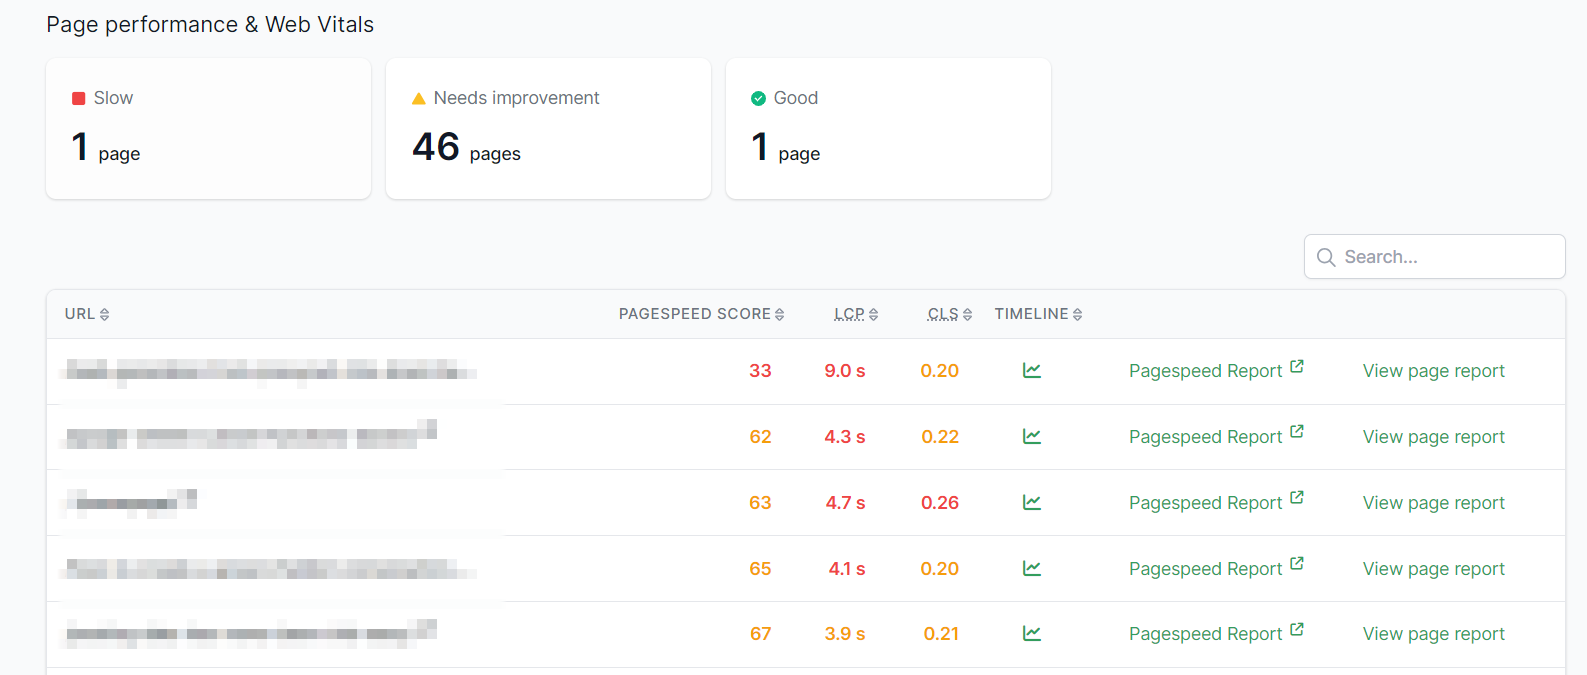
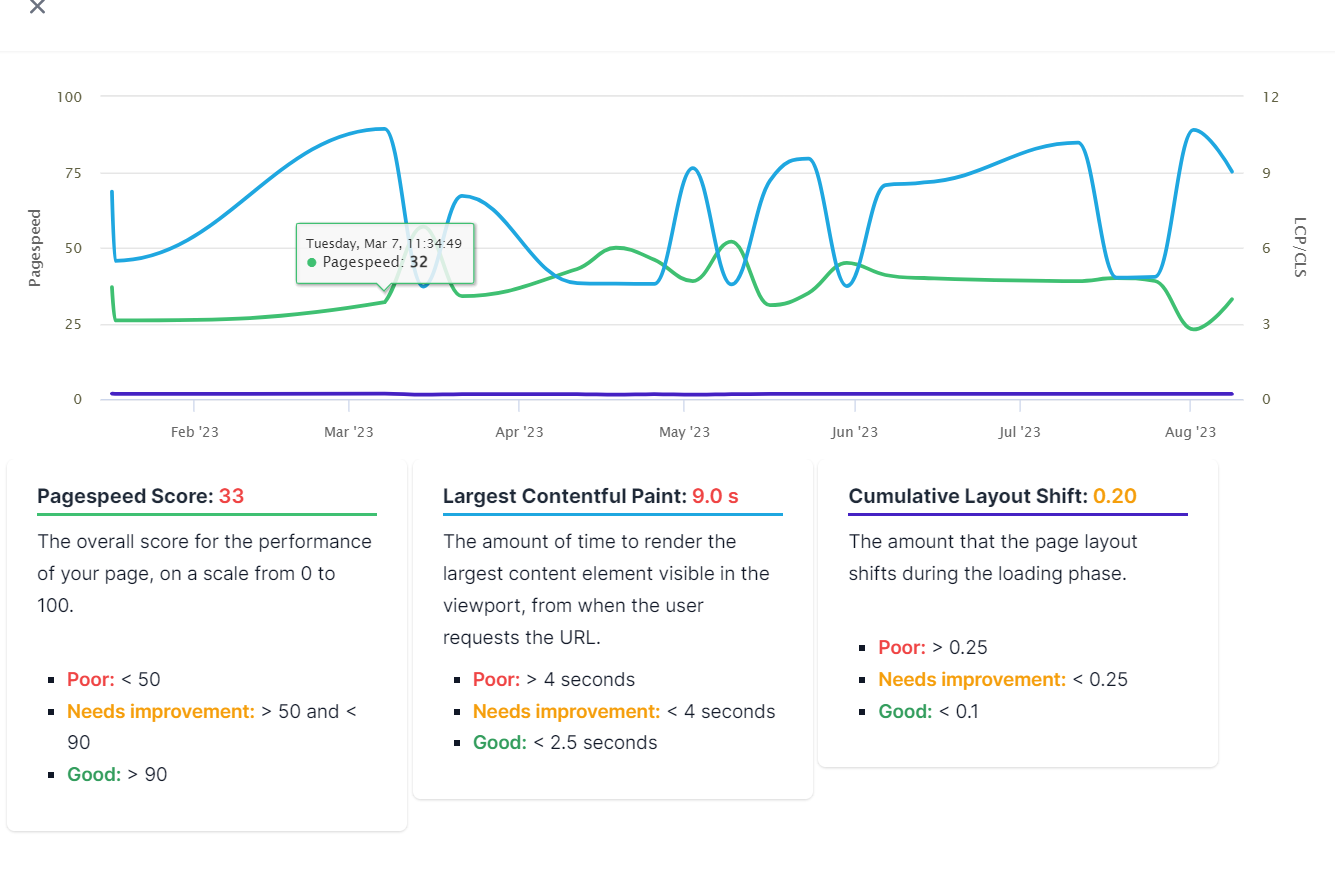
If you click on the little graph icon, that's your Timeline. It'll show you how a specific page performed historically.
Right below it, you'll get a detailed explanation for each score.
As for the Pagespeed Report link, it'll take you to the source itself.
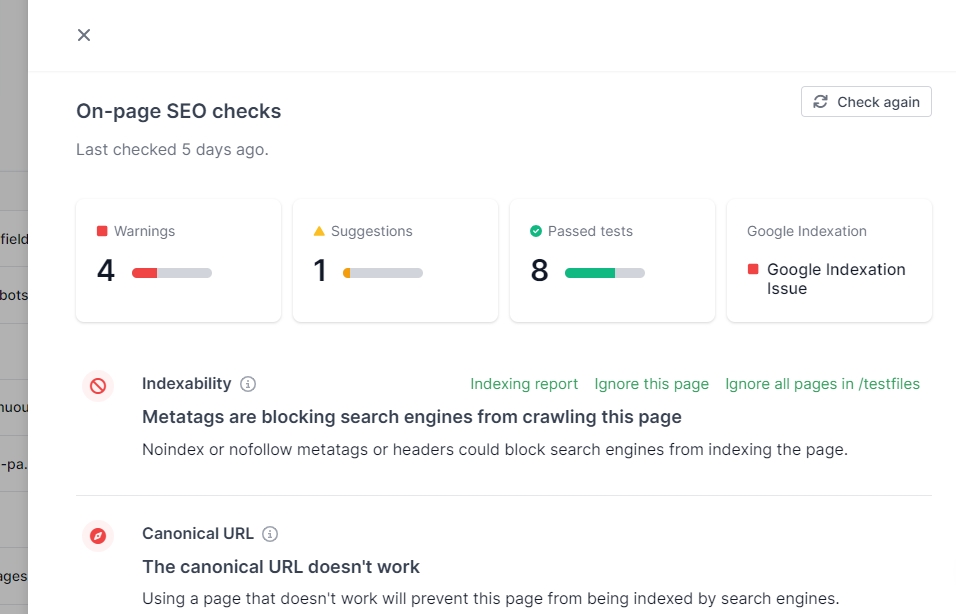
The View page report link will give you the scoop on any on-page SEO checks beyond page speed.
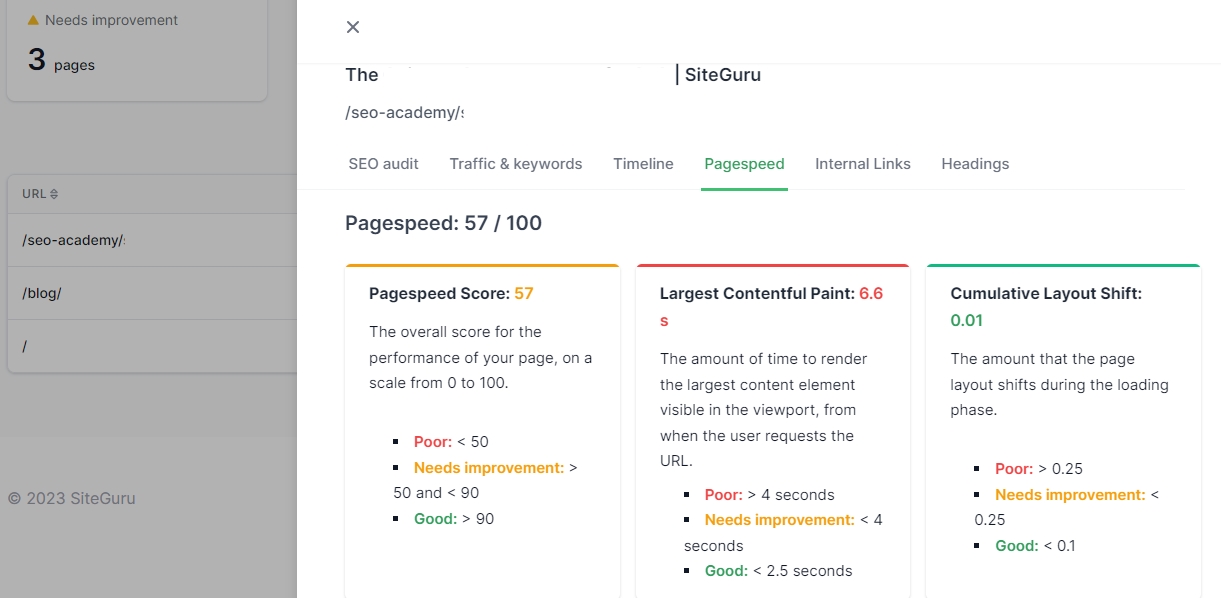
When in the Pagespeed tab, click through on a page and select the ‘Pagespeed’ tab to see the details of its performance:
Now, let's get down to brass tacks! Here's how you can improve your page speed based on SiteGuru's top recommendations.
How to Improve Your Page Speed
Preload LCP Image
LCP is the time it takes to load the largest, most important element "painted" within the viewport area of the visitor's browser.
It should be 2.5 seconds or less.
When you preload the LCP image, which is typically the image of your hero section, it'll be displayed earlier in the visitor experience. Not only does preloading the image improve the LCP score, but it also indicates to your visitor that the content of your page is loading fast.
To preload LCP image, add the following code to the <head> section of your HTML:
<link rel="preload">
<link rel="preload" href="/path/to/image.jpg" as="image">
Reduce Unused JavaScript
Render-blocking resources, as the name suggests, block the rendering of the rest of your page until they're fully loaded.
JavaScript is treated as a render-blocking resource, especially when it involves external scripts that the browser must fetch before downloading, parsing, and executing them. Depending on the type of scripts we're talking about (such as third-party tracking codes), the roundtrip can be long.
Unused JavaScript can also refer to bloated code from plugins, as well as animations and interactive elements on your page.
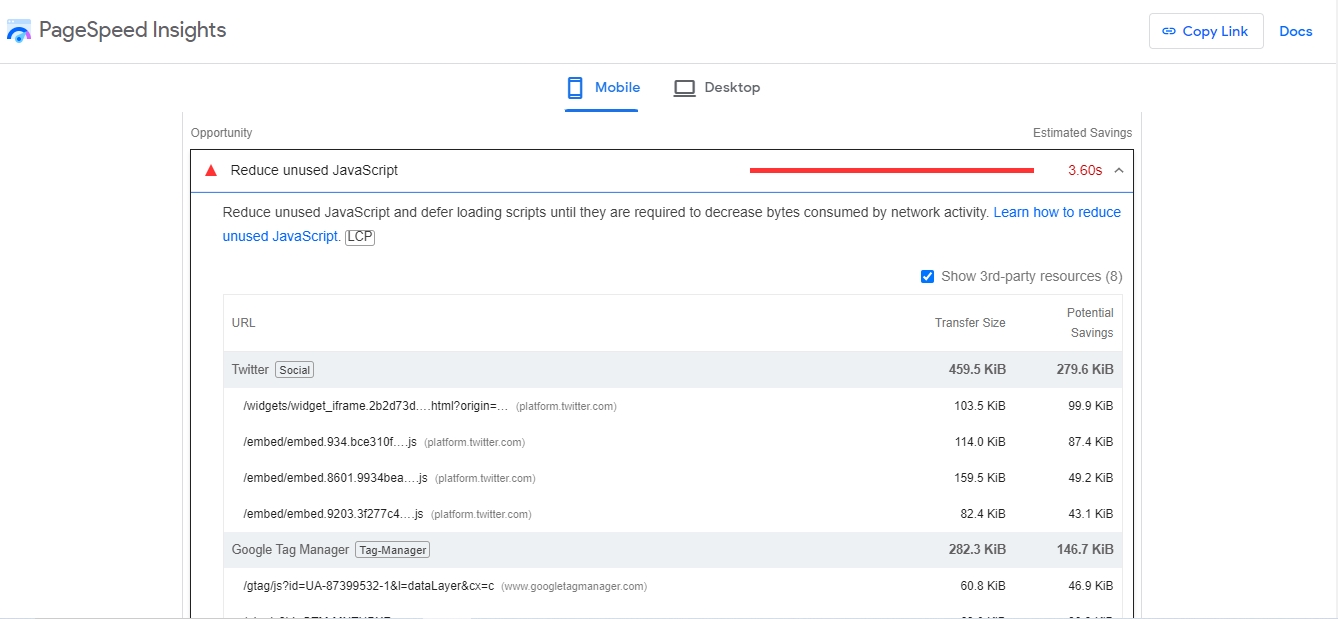
You can easily spot the perpetrators in the Coverage tab of Chrome DevTools or by clicking on the “Pagespeed report” for the target page in SiteGuru:
If you aren't supposed to remove the JavaScript in question but still need to reduce its execution time, you can reduce render-blocking portions by delay loading or minifying them.
Check out my full guide on how to reduce unused JavaScript.
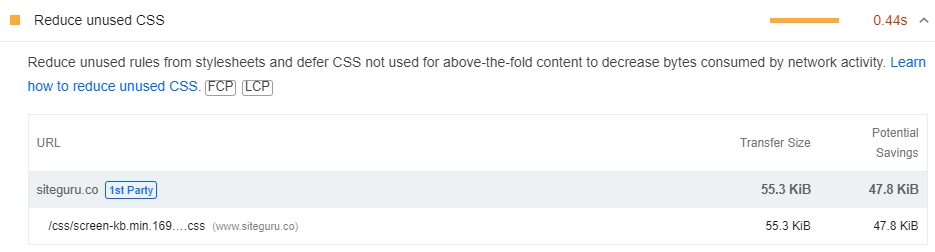
Reduce (or Remove) Unused CSS
Have you ever visited a page only to be served a bare-bones, unusable HTML version?
That's a page without CSS or without any styling information. The appearance of your website depends on it.
However, both your website theme and plugins will likely contain unnecessary CSS code. Removing or deferring the bits not used for above-the-fold content is vital to keeping your CSS lean.
Similarly to JavaScript, CSS is also considered a render-blocking resource by default. That's because it'll block your page's rendering until all external stylesheets are fetched and processed.
That could take a long time and decrease your page speed as a result.
Again, click on the offending page in SiteGuru to view the Pagespeed Insights report with all the offenders (or use the ???????????Coverage tab of Chrome DevTools):
Reduce Initial Server Response Time
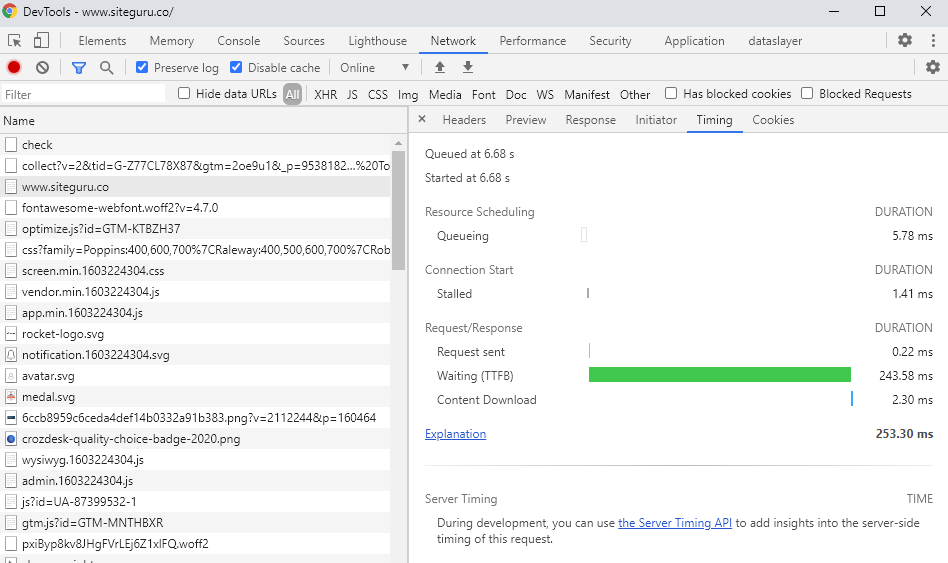
Time To First Byte (TTFB) score? It measures server response time, or how long it takes before the visitor's browser gets a response after sending an HTTP or HTTPS request.
Ideally, most sites should aim for a Time To First Byte of 0.8 seconds (800 milliseconds) or less.
You’ll see any issues with TTFB in your SiteGuru report.
Alternatively, you can find the Server Response Time by using the Network tab in Chrome Dev tools, under the Timing tab:
So, how can you improve server response times?
- Use a TTFB checker like Domsignal to check your current TTFB.
- Invest in faster hosting providers. Otherwise, you'll suffer from slow response times.
- Avoid using too many plugins. Overloading your themes can make your site unnecessarily slower.
- Improve caching. Caching stores quick-access copies of your pages, so you don't have to fetch them from scratch whenever a user loads them.
- Use a Content Delivery Network (CDN) like Cloudflare. Essentially, a CDN places copies of a website's content in different places around the world so that it can load faster regardless of users' location.
Properly Size Your Images
Images can hamper the performance of your page if you misuse them, especially when it comes to their size.
I get it: you want your image to be as high-quality as possible. But if an image is displayed as, say, 400 x 400 pixels, there's no need to upload a massive 3000 x 4000 image.
If this is the case on your site, PSI will tell you to Properly size images.
To fix the issue, all you have to do is change the dimensions of your image to the size shown on the page.
Alternatively, you can use responsive images, which allow you to vary the dimension of your images depending on the visitor's screen size.
(Whatever you do, don't try to compress images, as most formats already include compression!)
I give a quick explanation + a simple code you can use to generate responsive images here.
What's Slowing Your Pages Down?
As you can see, plenty of factors can decrease your PageSpeed scores and have your users gnashing their teeth.
But if you follow the above tips (and especially if you use SiteGuru), you'll no longer have to check the performance of each page individually.
Instead, you'll be able to spot the stragglers at a glance and fix the issue right away!
