
Core Web Vitals and Largest Contentful Paint
In May 2020, Google introduced the concept of Core Web Vitals. This consists of 3 important metrics that - among others - determine the user experience of a web page:
- Largest Contentful Paint: how long does it take for the main content of the page to be loaded.
- First Input Delay: how long does it take before a visitor can start interacting with the page.
- Cumulative Layout Shift: is the page stable, or does it shift a lot during loading.
These are important metrics. Not just for SEO, but especially for the user experience of your site. Improving these metrics helps your rankings, and also makes your visitors happy.
Largest Contentful Paint or LCP is the focus of this article. LCP aims to accurately predict how your visitor experiences your website.
What is Largest Contentful Paint?
Here's the official definition: The Largest Contentful Paint (LCP) metric reports the render time of the largest image or text block visible within the viewport.
The viewport is everything that fits onto the visitor's screen. The time it takes to load the largest element within that area, whether it's an image, a video, or a block of text is the LCP.
To summarize: LCP is how much time it takes before the visitor sees the most important content on his screen. Anything that's not directly in the viewport, is not included in this calculation.
How is LCP Calculated?
Here's an example: Imagine you have a page with 50 images, and only the top 10 are visible directly in the viewport, and the other 40 are only visible after scrolling. Loading those first ten images would be included in the LCP, while the other 40 are not. That makes sense because as a visitor, you just see those ten at first. Loading those ten images within 2.5 seconds will give the visitor the impression the page loaded quickly: a happy visitor!
Google recommends that it should take no more than 2.5 seconds to load that element. Anything slower than 4 seconds is considered poor.

The viewport is different on mobile versus desktop. That's why mobile and desktop both have their own LCP score.
How do I find my LCP?
As with Cumulative Layout Shift, there are a few ways to find the LCP score for a page.
Google Pagespeed Insights
Run a page speed check in Google Pagespeed Insights and you'll see the LCP score listed in the Lab Section data.
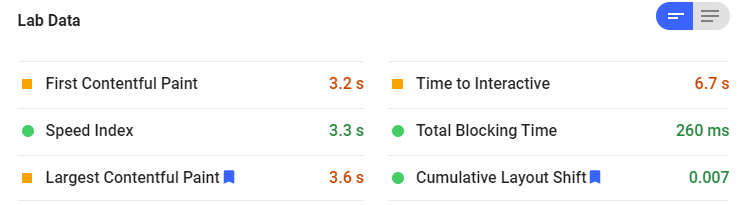
Depending on the amount of real-life data Google has on your site, the report may also include Field Data: data gathered on real user experiences.
In the Diagnostics section, the Largest Contentful Paint element is specified, so you know which element Google uses to calculate the LCP. Pro-tip: you can switch between Mobile and Desktop to see the differences across devices.
Google Search Console
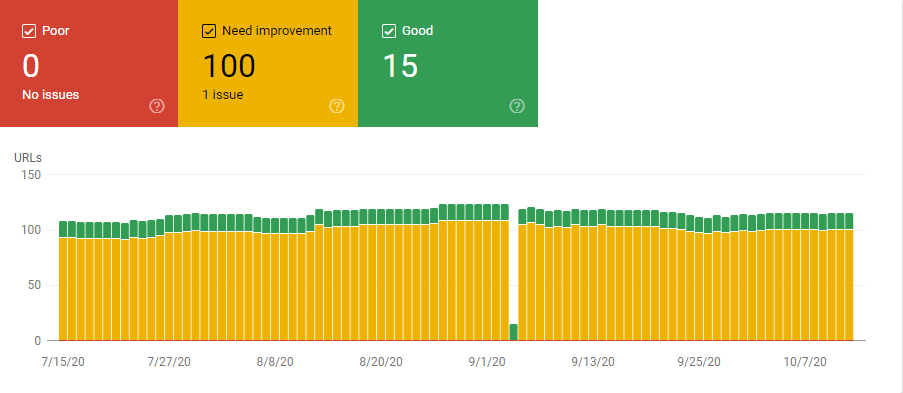
In the Enhancements Section of Google Search Console, you'll see the Core Web Vitals tab. It shows you which pages have a good or poor performance, and which pages need improvements. Keep in mind that this is not just LCP, but also includes Cumulative Layout Shift and First Input Display.
Google Lighthouse
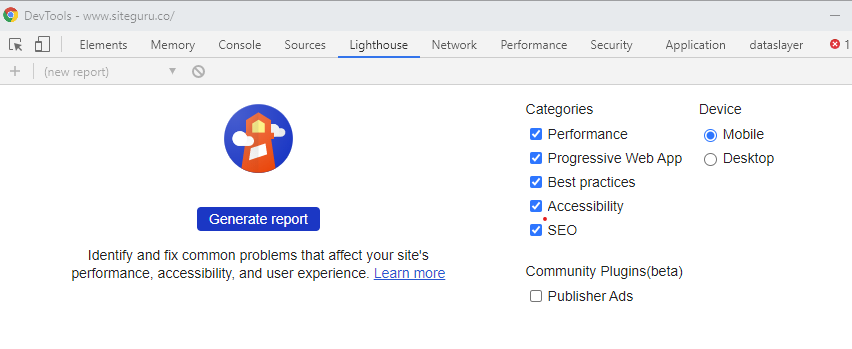
In Chrome Devtools, you'll find the Lighthouse tab. Click the Generate Report button to get a full performance report, including the Largest Contentful Paint. You'll notice that this is very similar to the Pagespeed Insights report, with one extra benefit: you can run Lighthouse on pages that aren't public yet. That makes it a great tool to test websites in development or testing.
SiteGuru pagespeed report
To quickly see the LCP for hundreds of pages, you can use SiteGuru's Pagespeed report. After your site check has been completed, you'll see the page speed score, LCP scores, and CLS scores in the overview:

Please note that you need to enable Pagespeed checks in the site settings first.
How can you improve your LCP score?
By now you know LCP refers to the time it takes before the visitor sees the largest element in the viewport. There is a variety of reasons for this to take some time.
Speed up server responses
If your server is slow, it's going to take long before the user sees anything on her screen - let alone something meaningful.
A good way to find out if the serverside part of your website could be the problem is by looking at the Server Response Time or Time to First Byte: how long does it take before the visitor's browser gets a response after trying to open the website. Anything slower than 600 seconds needs optimization.
You can find the Server Response Time by using the Network tab in Chrome Dev tools, and clicking on the request of the page you're evaluating, and find the Timing tab::

Alternatively, use Geekflare's TTFB test.
If you've identified that the server might be causing a poor CLS score, there are a couple of things you can do to improve this:
- Use a faster hosting platform: slow hosting providers will result in slower response times.
- Use a CDN (Content Delivery Network): this is especially relevant if you have visitors from all over the world. A CDN places your website in a location that's physically closer to the visitor. As a result, it will load faster.
- Improve caching: most CMS's like WordPress allow you to cache certain pages. It will store a generated page and the next time a visitor tries to load that page, it will use that cached page instead of having to recreate it from scratch.
- Use pre-connecting to speed-up third-party connections. By adding the code below in the head of your page, you tell the browser that you need connections to these third-party domains as soon as possible:
<link rel="preconnect" href="https://www.google-analytics.com">
<link rel="preconnect" href="https://fonts.googleapis.com">This is especially useful for resources that are needed for displaying critical content. Consider using preconnecting for:
- Google Webfonts
- External javascript or CSS libraries
- External image services
- Google Analytics or Google Tag Manager
Remove render-blocking CSS and javascript resources
You'll often encounter the term Render Blocking Resources when optimizing your page speed. It refers to resources like javascript and CSS files that are required to load first before the page can be properly displayed.
There are a number of ways to prevent render-blocking resources:
- Minify CSS files: by making the CSS file smaller, it will arrive sooner. Most CMS's allow you to use a minified version of a file, and alternatively, there are various scripts that do this for you.
- Minify javascript files: similar to CSS files, you can minify Javascript to improve page speed.
- Place critical CSS inline: place all critical CSS in the source of your HTML file (inline). The browser won't have to wait until the full CSS file is loaded to render the first part of the page
Keep in mind that it can be hard to identify which CSS is critical and that this may change over time. Although this may include a bit of maintenance, it can have a big positive impact on LCP.
There are some tools like criticalCSS to help you do this. It basically identifies all the CSS that is needed to show the 'above-the-fold' part of the page and places that into a smaller, separate file.
Optimize images
Images have a major impact on LCP, especially if they are not optimized for speed. Many websites use an image in the header, and therefore this is often a bottleneck for LCP. Luckily, there are a couple of easy ways to improve image performance:
- Use modern image formats (JPEG 2000, JPEG XR, or WebP)
- Use the right size: don't load big images on mobile, but instead use responsive images.
- Compress images using a tool like Kraken.io
Enable compression
Much like a zip file enables you to compress and send large files, web server compression reduces the amount of data your server needs to send, making it a lot faster. Compressing files can reduce the size by up to 80%. Compression is very easy to set up and can have a big impact on your page speed.
GiftOfSpeed lets you check if you're already using compression. If you haven't already, enable GZIP or Brotli compression on your server for CSS, HTML, and Javascript files to speed up performance.
Leverage server-side rendering
Frontend frameworks like React and Vue are becoming more and more popular and often rely on client-side rendering. The server sends your visitor basically an empty shell, and on the client-side, this is populated with meaningful content.
This can have a detrimental effect on LCP: your visitors won't be able to see or use the main content until the client-side execution is finished.
Luckily, most of these frameworks now support some kind of server-side rendering. This reduces the amount of javascript work the browser needs to do, speeding up the load times of the page.
Conclusion
Do yourself and your visitors a favor, and bring down that LCP score to under 2.5 seconds. As a result, your visitors will enjoy a fast-loading page, and you'll benefit from higher rankings in Google.
