
You know page speed is important. It impacts both your search engine rankings as well as your user experience. There are numerous tools that help you find out how your website performs. This article explains how to measure your page speed and what metrics to consider.
The goal of measuring your page speed
Every tool you use to measure your page speed will give you a numeric score or a grade that describes how your site performs. That number in itself doesn’t say much: is a 70 out of 100 score in Google Pagespeed something to worry about?

More important are the suggestions that the various tools give you to improve the page speed. Quite often these are actionable hints that may or may not require a lot of effort, and have a big impact on page performance.
As an SEO you’ll likely have limited development capacity at your disposal. Your job is to work together with developers to identify low hanging fruit: improvements that can be made relatively quickly, and have a positive impact on the performance.
You’ll never get to a page speed score of 100, and you don’t need to. But you can use the tools to identify issues and boost performance.
Google Pagespeed Insights
Google Pagespeed Insights is a tool provided by Google. It’s free, it’s quick, and it’s often very accurate. Pagespeed Insights runs on the Lighthouse technology, just like the Lighthouse tab in Chrome Dev tools.
Pagespeed Index
Pagespeed Insights takes about 10 seconds to run and gives you an extensive performance report. The most prominent metric is the page speed index (PSI): a score from 0 to 100, 0 being extremely slow, 100 being super fast.

The score is calculated by 6 underlying metrics:
- First Contentful Paint: how long does it take for the first content to appear
- Speed Index: how quickly are the contents visible
- Largest Contentful Paint: how long does it take for the biggest item in the viewport to appear
- Time to Interactive: how long it takes before the page is fully interactive
- Total Blocking Time: how long does it take before the user can start using the page
- Cumulative Layout Shift: how much do the elements on the page move during page load
Source: https://web.dev/performance-scoring/
Each of these metrics is shown in the Lab Data section, showing un in green (good), orange (needs improvement), or red (poor). This helps you find out why your overall page speed score is what it is.
Google considers anything over 90 as a fast page. Anything under 50 is considered slow, and scores between 50 and 90 are classified as needs improvements.

Pro-tip: you should take this index with a grain of salt, especially when improving your page performance for SEO reasons. A score of 60 means you should definitely try to improve the performance. But don’t expect any ranking improvements by increasing the score from 80 to 90. The average user won’t notice the difference either.
Core Web Vitals
The reporting of the 6 detailed metrics include two of the three Core Web Vitals. In May 2020, Google introduced the concept of Core Web Vitals. This consists of 3 important metrics that - among others - determine the user experience of a web page. Don't be fooled by the fancy names, the idea behind it is rather simple:
- Largest Contentful Paint: how long does it take for the main content of the page to be loaded
- First Input Delay: how long does it take before a visitor can start interacting with the page
- Cumulative Layout Shift: is the page stable, or does it shift a lot during loading
Unfortunately, FID is not part of the visible metrics in Pagespeed Insights.
Difference between Mobile and Desktop
Pagespeed Insights shows a different score for mobile and desktop. You’ll often see that the mobile score is somewhat (or a lot) lower. The simulation for mobile differs:
- Using a slower mobile connection
- Using a mid-tier mobile device that is slower than the average desktop
Also, the difference in screen size may affect metrics like LCP and CLS. Whether you should use mobile or desktop score depends on your audience. If most of your visitors use desktop, you might want to settle for a good desktop score and a decent mobile score. However, if the majority of your visitors use a mobile device, aim to get a good mobile score too.
Difference between Lab data and field data
The Pagespeed Index we’ve discussed is based on lab data: Google simulates a page load on your site, and based on that one simulation, your web page is scored. That may not always fully reflect the real visitor’s experience.
Depending on how much traffic a website has, you may also see Field Data in the report. Field data represents the experience of real users over the last 28 days.
Differences in Field Data and Lab Data can have various reasons:
- Recent improvements in page performance take time to be reflected in the Field Data
- Real-world users may use slower connections or slower devices than the simulator for Lab Data uses.
Use the Field Data to get an idea of the real world user experience, but keep in mind that it won’t reflect any improvements directly. If you’re debugging, rely on the Lab Data instead.
Opportunities
The Opportunities section is the real value of Google’s Pagespeed Insights: it tells you what you need to do to improve the score.
The opportunities are prioritized by impact (estimated savings), and clicking on an opportunity shows more details.

Don’t blindly copy the list of recommendations and send it to your developers: work together with the technical team to see if there’s anything they can implement quickly.
It’s often relatively easy to implement recommendations like enable text compression or properly size images, whereas it can be a lot harder to remove unused CSS or javascript. Focus on the low-hanging fruit to get results quickly, and focus on the harder parts later - if that’s still needed.
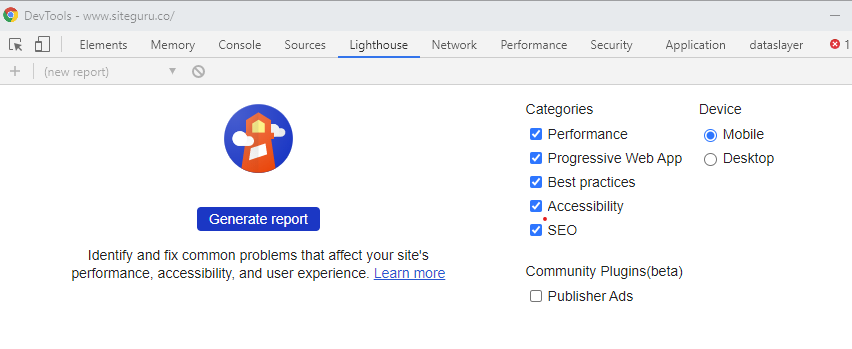
Lighthouse in Chrome Dev Tools
In Chrome Devtools, you'll find the Lighthouse tab. Click the Generate Report button to get a full performance report. You'll notice that this is very similar to the Pagespeed Insights report, with one extra benefit: you can run Lighthouse on pages that aren't public yet. That makes it a great tool to test websites in development or testing.
Google Search Console
Both Lighthouse and Pagespeed Insights give you a snapshot of your current performance, and if you’re lucky enough to have enough traffic, 28 days of Real User Data. It won’t show you how your page performance evolved over time.
That’s where Google Search Console comes in. In the Enhancements Section, you'll see the Core Web Vitals tab. It shows you which pages have a good or poor performance, and which pages need improvements.
Alternative tools
There are various alternative tools that help you measure page speed. No matter which one you use, try to stick to one tool. Every tool uses different metrics and works in a different way, so there’s no point in comparing the metrics coming from the different tools.
Pingdom
Pingdom is a tool that monitor’s websites and offers a free performance check. Much likes Google’s tools, it gives you a score, and some recommendations to improve the performance. It can be interesting to try Pingdom to find alternative suggestions.
GTmetrix
GTmetrics used to be an interesting alternative to Google Pagespeed Insights but is now also running on Lighthouse technology. That makes it reliable, but not very different from Google’s report.
Pagespeed in Google Analytics
In Google Analytics, in the behavior section, you’ll find the Site Speed section. It includes metrics like Average Page Load Time, Server Connection Time, Domain Lookup Time, and more. These reports can be useful to identify slow pages.
The data in Google Analytics may surprise you: it often looks a lot slower than what other tools tell you.
That has to do with sampling: the report only includes about 1% of all your visitors. If that small sample has a worse experience than average, the data may be misleading. Keep this sampling in mind while looking at the report.
You can use the siteSpeedSampleRate variable in the Google Analytics creation to increase the sample size from 1%, to for instance 10%.
Measuring page speed for all pages
The tools mentioned here are all great at identifying the page performance of a single page. Scanning every page individually, especially on a regular basis, is impossible.
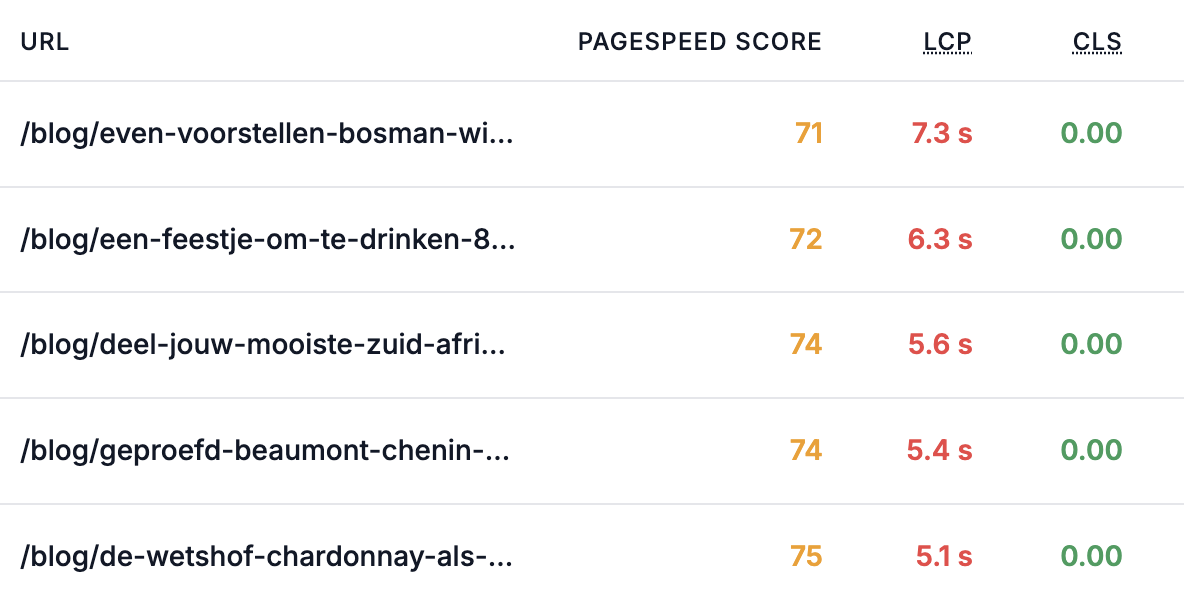
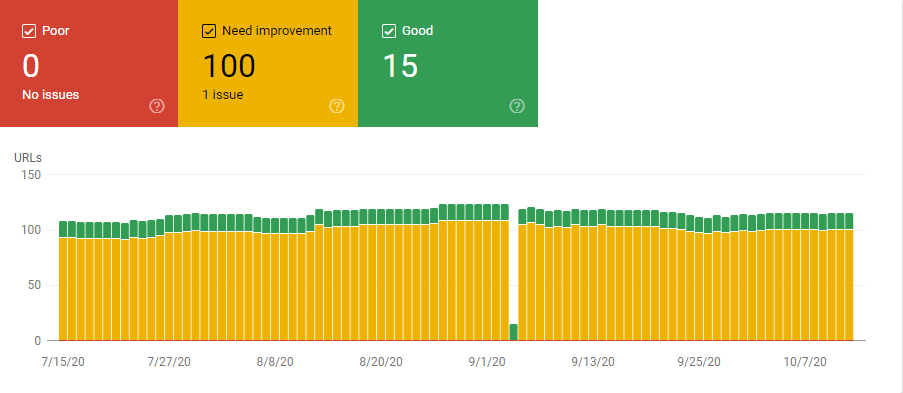
SiteGuru’s Pagespeed Report scans up to 100 pages using Google’s Pagespeed Insights. It shows the Pagespeed Index, Largest Contentful Paint, and the Cumulative Layout Shift for each of those pages.
